
An indicator that redraws yesterday’s signal can make an ordinary chart look remarkably accurate. In MT4, some historical values change because an algorithm uses later prices, recalculates unfinished bars, or receives revised price history. The visual result may be legitimate for analysis while remaining unsuitable as evidence that a trade could have been placed at the displayed moment.
For metatrader 4 users, the essential distinction is between what an indicator shows now and what its buffers contained when an order decision was possible. Five consequences deserve separate examination before linking such signals to a CFD strategy.
Future-Dependent Calculations Can Manufacture Earlier Entry Signals
Some indicators identify turning points only after several subsequent candles confirm them. A marker may eventually appear above a past high, although no marker existed there when that candle closed. Historical charts then display apparently precise reversal calls that were unavailable in real time.
A CFD strategy built from these revised markers can produce exaggerated backtest results if it treats final chart values as contemporaneous signals. Examine whether the formula references future bars, how many confirmation candles it requires, and when a plotted marker first becomes visible.
Unfinished Candles Can Trigger Orders That Later Lose Their Justification
Not every changing value represents improper repainting. A moving average or momentum indicator calculated on the current candle naturally changes as new ticks arrive. An Expert Advisor reading buffer index zero can act on a threshold crossing that disappears before the candle closes.
The trade remains open even after the visual evidence vanishes. Check whether the algorithm reads the forming candle or the last completed one, and compare tick-by-tick alerts with closed-bar signals. Waiting for confirmation reduces false intrabar triggers but may sacrifice a favorable entry price.
Repainted Stops Can Understate Losses in Historical Tests
Imagine a hypothetical palladium CFD strategy that buys 15 ounces at $1,080 after an indicator plots support at $1,072. The initial stop is placed at $1,070, representing $150 of price risk. Two candles later, the indicator recalculates and redraws the earlier support at $1,064, making the original chart appear to justify a wider stop.
If an automated routine follows that revised level and moves its stop to $1,062, the potential loss increases to $270, excluding execution costs. The extra $120 of exposure arises from changing an order based on information that was not available at entry. Record the original buffer values and actual stop modifications rather than reconstructing them from the finished chart.
Reloaded History Can Change Signals Without a Market Event
A terminal reconnecting after a data interruption may download missing candles or correct historical bars. An indicator can then recalculate a larger section of its buffers, changing old values even when the formula does not deliberately look ahead.
For metatrader 4 strategies, this creates a reproducibility problem: two runs using different historical snapshots can disagree about whether a CFD entry qualified. The more surprising result is that a supposedly non-repainting indicator can still produce revised historical signals after a data repair. Preserve source data, timestamps, indicator settings, and platform logs when comparing test results.
Buffer Revisions Can Desynchronize Alerts and Automated Positions
An indicator may erase or relocate a marker after an Expert Advisor has already opened a position. If the program checks only the latest chart state, it may fail to recognize why the trade exists, issue a duplicate entry, or close exposure on a signal that has been retroactively withdrawn.
A reliable audit therefore needs event-time records, not screenshots alone. Before opening a CFD through an indicator-driven strategy, run a forward test that logs each signal’s timestamp, buffer index, initial value, later revisions, and resulting order instruction; then compare those records with the completed chart.

Super Sale Live

Meerut is India’s cricket manufacturing capital, and these major platforms offer a variety of options ranging from budget-friendly Poplar & Kashmir willow.
Buy NowTop rated
-
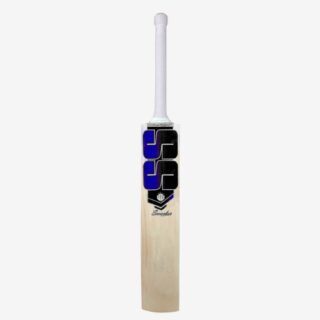 Kashmir Willow Cricket Bat, Full Size, Lightweight bat for 15+ years, 33 inch
Original price was: ₹3,499.00.₹1,499.00Current price is: ₹1,499.00.
-
 Volleyball for Training & Practice
Original price was: ₹999.00.₹399.00Current price is: ₹399.00.
-
 Basket Ball for Boys Training & Recreational Ball
Original price was: ₹1,250.00.₹599.00Current price is: ₹599.00.
-
 World Cup Qatar Football - Size 5 Standard
Original price was: ₹1,250.00.₹599.00Current price is: ₹599.00.
-
 World Cup Football
Original price was: ₹999.00.₹499.00Current price is: ₹499.00.
Products
-
Kashmir Willow Cricket Bat, Full Size, Lightweight bat for 15+ years, 33 inch
Original price was: ₹3,499.00.₹1,499.00Current price is: ₹1,499.00.
-
Volleyball for Training & Practice
Original price was: ₹999.00.₹399.00Current price is: ₹399.00.
-
Basket Ball for Boys Training & Recreational Ball
Original price was: ₹1,250.00.₹599.00Current price is: ₹599.00.
-
World Cup Qatar Football - Size 5 Standard
Original price was: ₹1,250.00.₹599.00Current price is: ₹599.00.
-
World Cup Football
Original price was: ₹999.00.₹499.00Current price is: ₹499.00.